
Having spent nearly a decade in analytics and data science, I have worked with a large variety of business stakeholders across sales, marketing, risk and product in various industries.
And what I have noticed is, as businesses make efforts to become more data-driven, access to data and tooling around data have improved significantly but conceptual frameworks for leveraging data to guide decision making are still very ad hoc and subjective in nature.
This often creates situations where data plays a very peripheral role, giving businesses the illusion of being data-driven – monitoring KPIs and conducting superficial analysis on high-level metrics without considering causal effects or rigorously testing hypotheses.
Analysts will often be looped in to conduct analyses on a new product or feature after it has already been launched, leading to poorly designed soft launches that are conducted in a way that cannot answer the key questions required to scale the product or feature.
Beta testing a new feature with your most active or high-value customers, for example, is a common practice – this ensures adequate usage of the feature, but gives you no information about the right target market, the potential size of the market or scaling strategies for the feature, as the audience is biased and any analysis or KPIs measured would not generalize across your customer base.
My aim here is to use our marketing efforts at Instamojo as a case study to illustrate a framework for businesses to use in their decision making.
Think of product development/marketing/sales/etc. as a series of experiments that are designed to answer key questions that will continuously refine business strategy and guide their next set of experiments.
Key components of an experiment
Whether we are talking about a marketing campaign or a new product or even a simple UI revamp, there are 3 key components to any business decision –
- Objective – what do we hope to achieve by doing this?
- Success criteria & key metrics – what key metrics need to go up or down to achieve this objective?
- Movable levers – what levers do I have at my disposal to optimize for these metrics?
Let us now define the above for our marketing efforts around MojoCommerce.
First, some context on MojoCommerce – Instamojo offers solutions to businesses running online stores – store building and hosting, payments, CRM and a simple UI, all packaged in a single platform – (MojoCommerce).
It is a freemium model where businesses can try the product out for free and build out a basic store, but to access the full suite of solutions, there are premium plans that have a monthly/annual subscription fee.
Sign up for your own free online store or the premium version that starts at just ₹10/day!
Our digital marketing campaigns aim to spend money on Instagram and Facebook advertising in order to acquire businesses that show true intent, to build their store on MojoCommerce and upgrade to premium plans. So let’s dive in.
Objective
To develop a sustainable customer acquisition strategy for MojoCommerce – create Ads, spend money to get leads, and the sales team contacts these leads to guide them and convert them to premium plan customers.
Success Criteria & Key Metrics
Cost per Upgrade – this is the primary metric of interest as the holy grail of these campaigns would be to acquire premium users at a cost that is lower than the revenue generated through premium subscriptions
This is however a composite metric that appears at the end of a longer funnel.
The funnel looks like this –
- Cost per click – Are users attracted to the Ads they see?
- Cost per signup – Are the landing pages inspiring them to sign up?
- Cost per Upgrade – Are we convincing them of the value of our premium offerings?
Movable levers
When we say movable levers – we are referring to the aspects of our marketing strategy that are in our control.
- Target Audience – This can be fed to Ad engines on Facebook and similar platforms in 2 ways
- Heuristics – filters such as demographics, profile attributes, pages followed, etc.
- Lookalikes – feed a list of users and the Ad engine finds similar users to target
- Platforms to run Ads on -Facebook, Instagram, Youtube, desktop vs mobile
- Spend allocation of different Ads – Best time in a day, the best day in a week
- Ad creatives and landing pages – The design and creative aspect
- Sales team processes – Who to contact/when to contact
Experiment Design
Now we tie these components together to create an iterative framework that we can over time optimize for our success criteria –
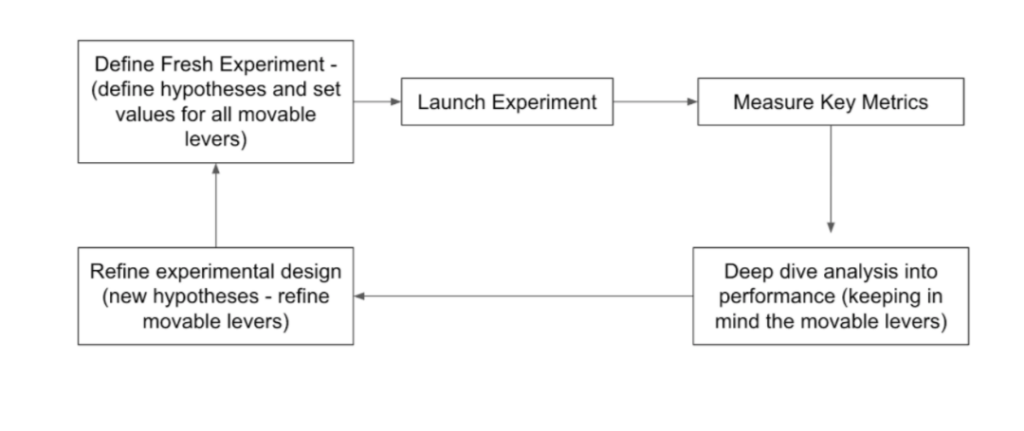
Having established this framework, we started our journey into refining our marketing strategy
Related read: Top eCommerce metrics to track and how to use them to grow your business
Phase 1: Cold start, no historical data to work with
Initially, we had no history of marketing campaigns to analyze, but we did have organic user behaviour that could be used to start formulating hypotheses.
We found a set of attributes that were key indicators of a strong propensity to upgrade to premium plans –
- Getting store visitors via social media pages (Facebook and Instagram)
- Merchants selling physical products (as opposed to events, services, etc.)
- Age groups 21-65
There are of course several movable levers outside of the target audience criteria, but it is important not to test too many hypotheses at the same time, as this will lead to insufficient sample sizes to arrive at conclusive results quickly.
We prioritized a set of broad hypotheses to test in our first set of experiments –
- Audience type: Lookalike audiences would outperform heuristic-based audiences (easier to do narrow targeting in lookalike audience lists)
- Platform: Mobile would outperform desktop (social media-based businesses operate primarily out of mobile)
- Target audience: Users getting visitors from social media pages, selling physical products and aged 21-65 would form the strongest lookalike audience criteria
We simultaneously launched a set of campaigns to control for each of these criteria (desktop vs mobile, heuristic vs lookalike), and found that all 3 of our hypotheses were correct.
Hence, going forward, our focus was primarily on mobile ads, using lookalikes based on our target audience criteria.
Phase 2: Refining our lookalike criteria and looking into other movable levers
Now that our broad strategy was defined, we focused on improving our target audiences as that seemed to be the strongest driver in reducing our cost per upgrade.
The main idea is that the more uniform the audience list, the easier it will be for the Facebook Ad engine to find similar users. We also now had some data on campaign performance, which we could use to look into fresh movable levers such as spend allocation and sales team processes.
Some observations that we made:
- We found that the majority of drop-offs in user activity happened within the first 3 days post signup, indicating that early sales contact is important.
- We also saw that a lot of our Ad spend during non-business hours (late nights, early mornings) were not yielding any results.
Based on this, we defined a fresh set of hypotheses
- Category-specific campaigns would outperform generic ‘physical product seller’ campaigns (e.g. purely apparel based audiences, purely home decor based audiences)
- Early sales contact will increase the retention and hence upgrade rate of users
- Cutting non-business hour advertising would improve our cost per upgrade
Once again, we launched a set of campaigns to control for these parameters and changed our sales team processes to ensure early-stage contact.
Our hypotheses did play out as expected, and category-specific campaigns in particular outperformed generic campaigns by a very large degree.
Diving deeper into the category-specific campaigns gave us a lot more insight into how we could improve our targeting.
Our findings:
- We saw that not only did category-specific campaigns outperform generic ones, but also the best-performing Ad creatives were also category-specific (e.g. for an apparel campaign, the best creatives displayed apparel related stores and had apparel specific messaging)
- We also saw that the business category information that we collect can in many cases be ambiguous or broad, leading to non-uniform audience lists and sub-optimal targeting. For example, ‘Home Decor’ can encompass anything from indoor plant sellers to furniture sellers to handcrafted lamps and wall hangings.
These products from the Instamojo online store ‘The Key Bunch‘ also fall under home decor.

Phase 3: Hyper-narrow targeting
Our previous set of experiments showed us that investing time and energy into better tagging of business categories would be well worth the effort, so we decided to look into modelling a users’ category based on their product images and descriptions.
This can be done by representing this information in the form of semantic embeddings that can then be clustered into similar products, which can then be rolled up at a user level. The technical details of this are quite complex and would require a separate article in their own right, but here is a simple visual that conveys the basic idea –
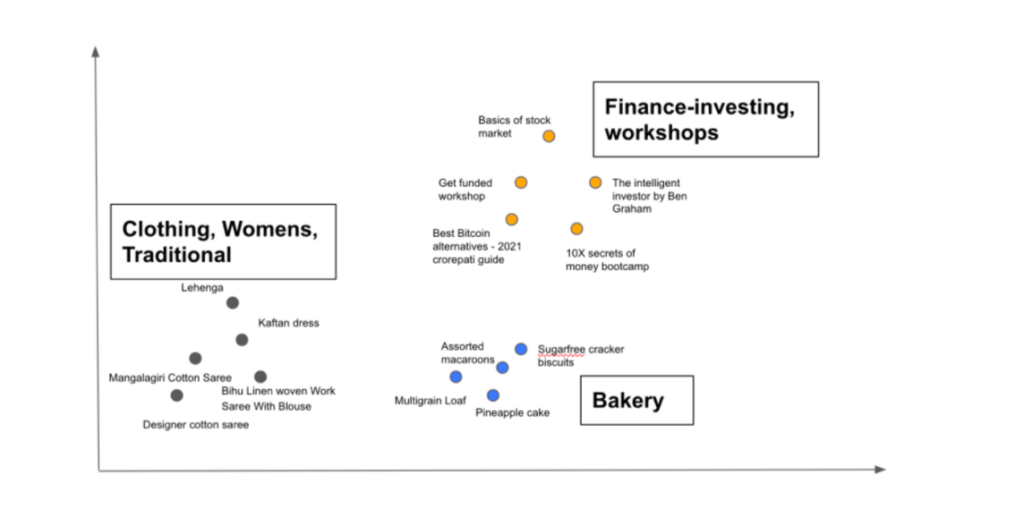
This allowed us to create extremely narrow audience lists (e.g. women’s traditional clothing, bakery, bath and body products) and corresponding creatives and landing pages.
These experiments are currently in progress and have so far outperformed previous iterations considerably.
Conclusion
By adhering to this iterative framework of hypothesis testing, we have over time reduced our cost per upgrade to almost 1/4th of our initial costs in less then a year, and by running these experiments in stages, we could gradually scale up our spending as we saw improvement in performance.
While this case study was a useful illustration, this framework is not limited to just marketing. The same approach can be applied to just about any business unit.
Define your objective and your success criteria, break it down into key metrics, and identify your movable levers.
Once this is done, start creating hypotheses, run experiments to test them and optimize for your success criteria.
This experiment is by no means a job done, there is still a lot of scope for improvement, but we have a framework that has proved to be effective in iteratively improving our targeting over time. And we are striving to continuously improve and optimise our customer acquisition efforts at Instamojo.
Create your online store for free
If you have questions or want to give Kaustub kudos, connect with him on LinkedIn or comment on this post.
1 comment
Very insightful. Thanks for sharing.