Understanding your customers is the key to a successful business, especially in eCommerce. And the only way to find out how your customers interact with your business is by tracking store analytics. Analysing data is not as hard as you think. In fact, you can easily find all the store analytics data you need on your Instamojo dashboard.
This blog will help you understand how to use the analytics available on the premium version of the Instamojo online store and its benefits.
How can I access store analytics on Instamojo online store?
You can get access to Store Analytics by subscribing to a premium version of the store. There are two subscription plans available to choose from. To know more about creating Instamojo premium online store, read this blog.
Once you sign in to your premium account, access the store analytics section from the left hand side of the dashboard under ‘Marketing’.
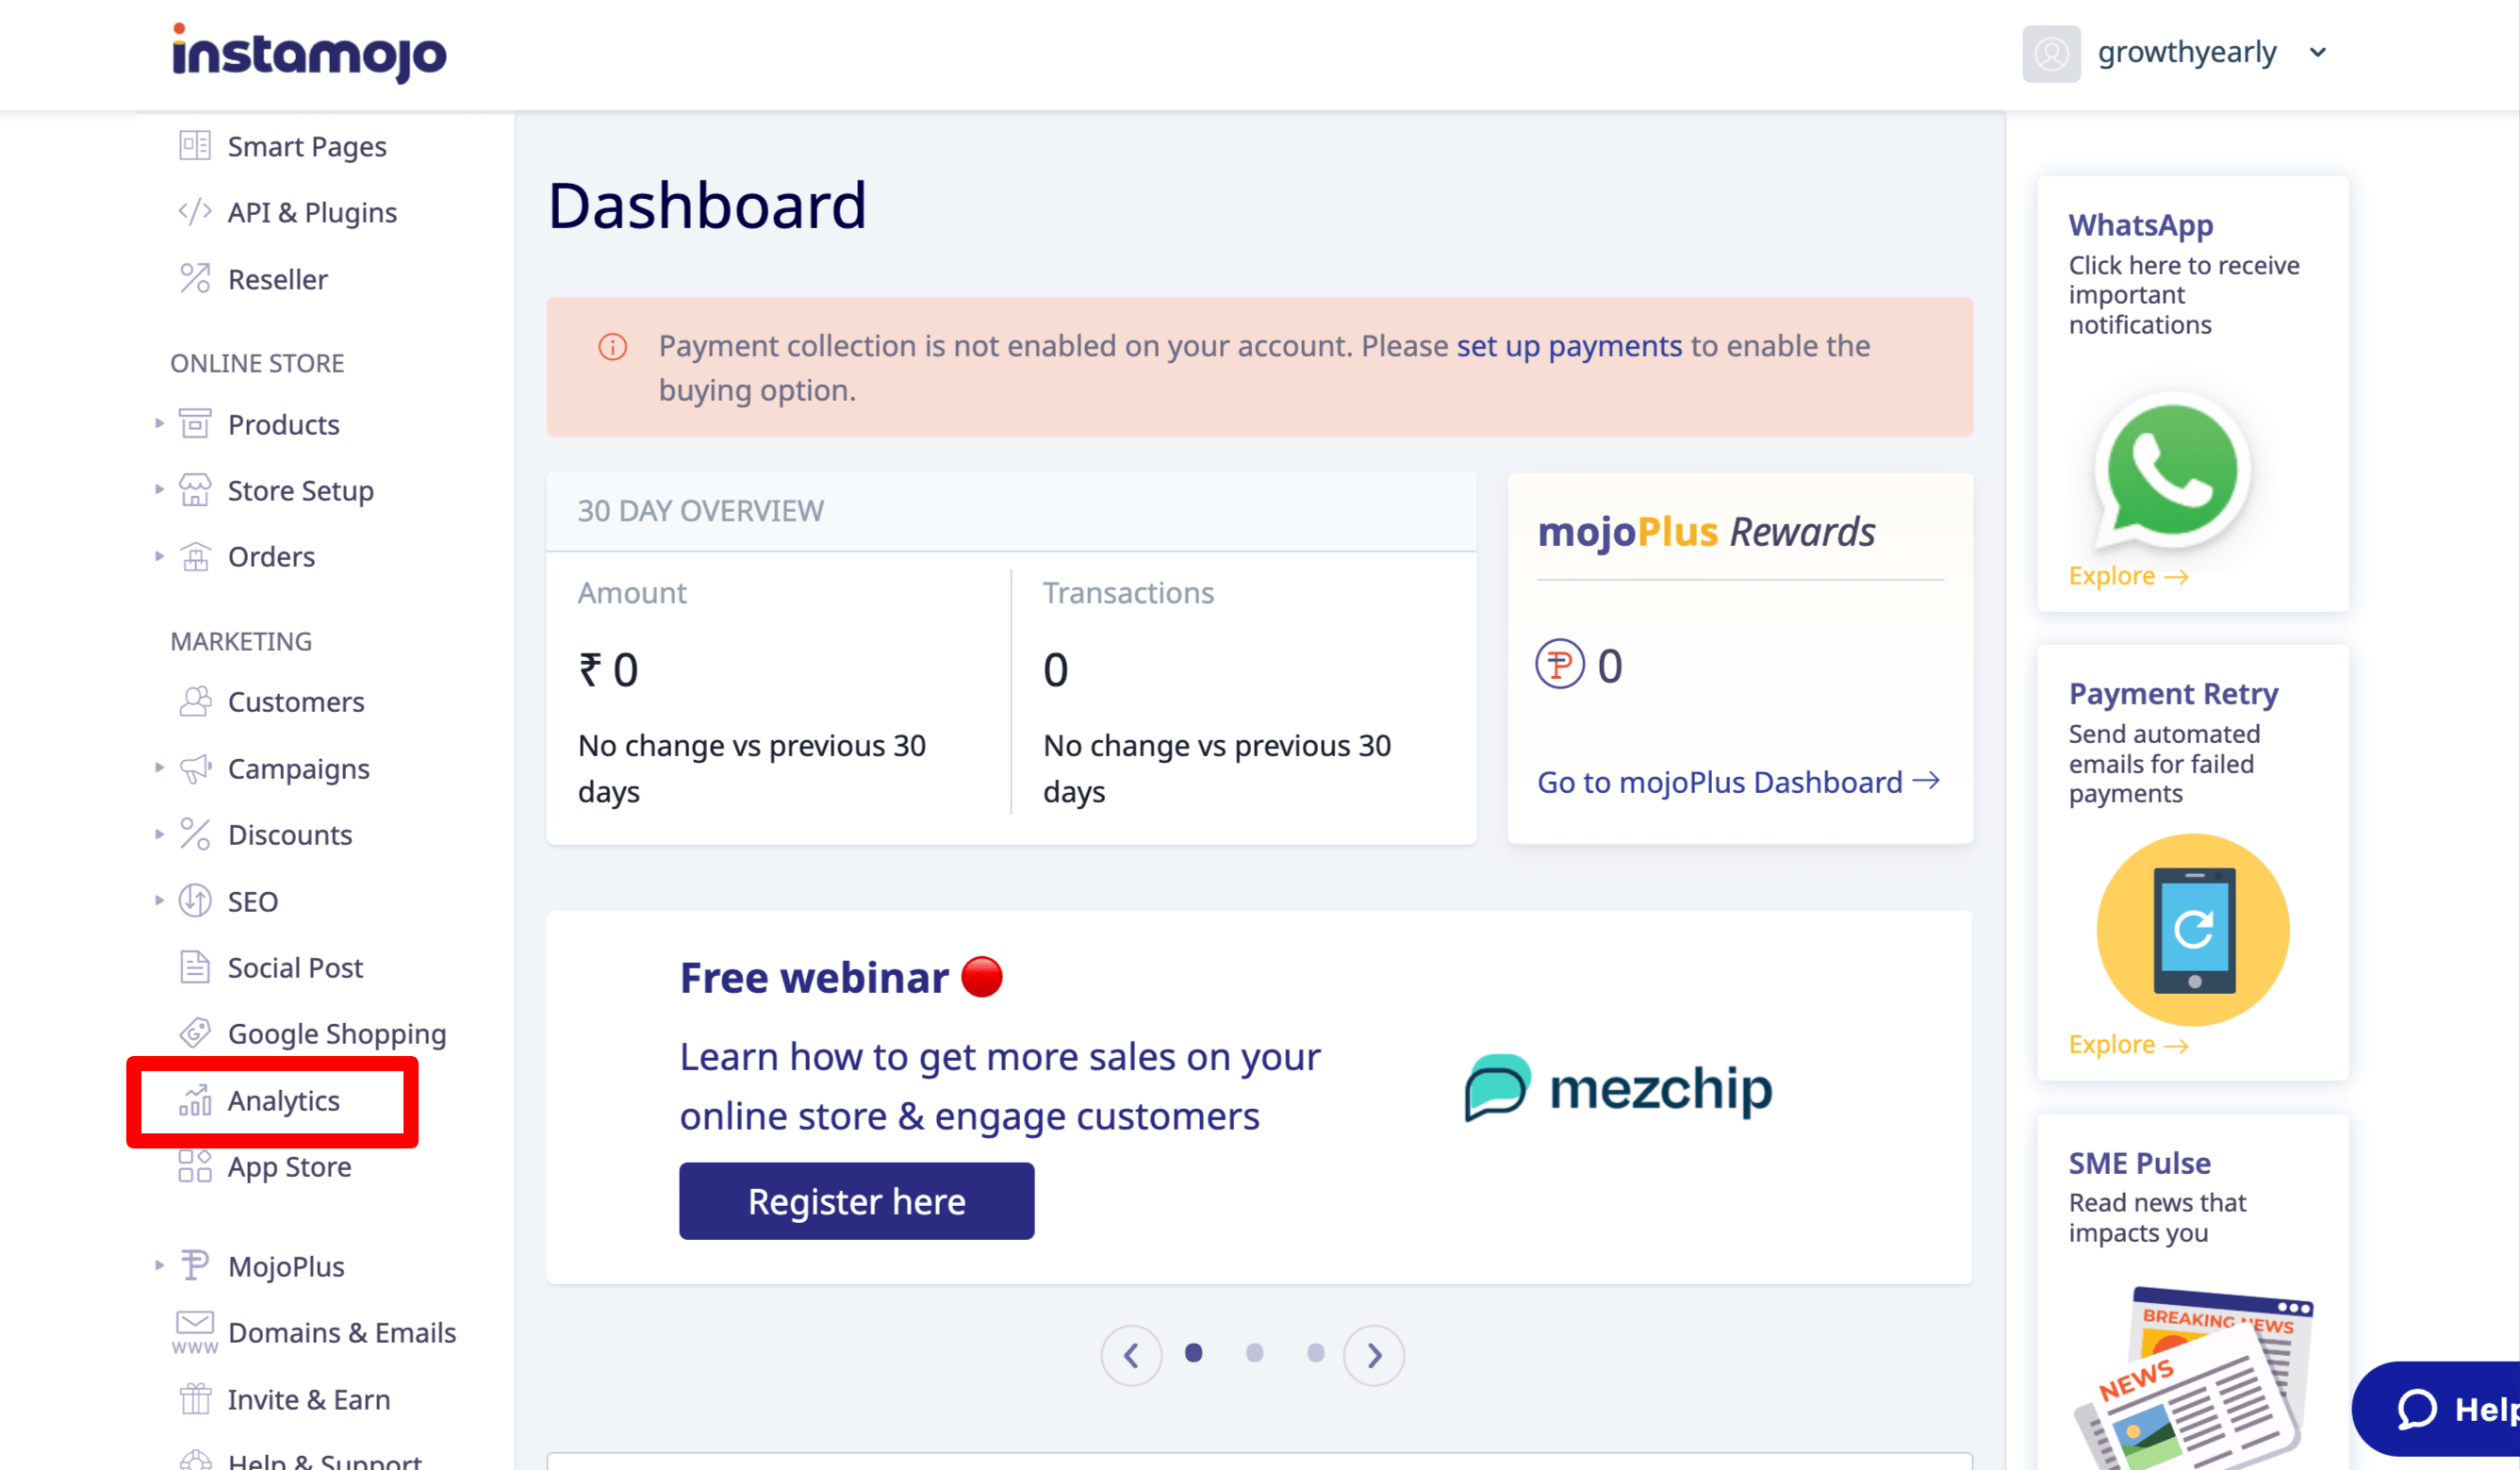
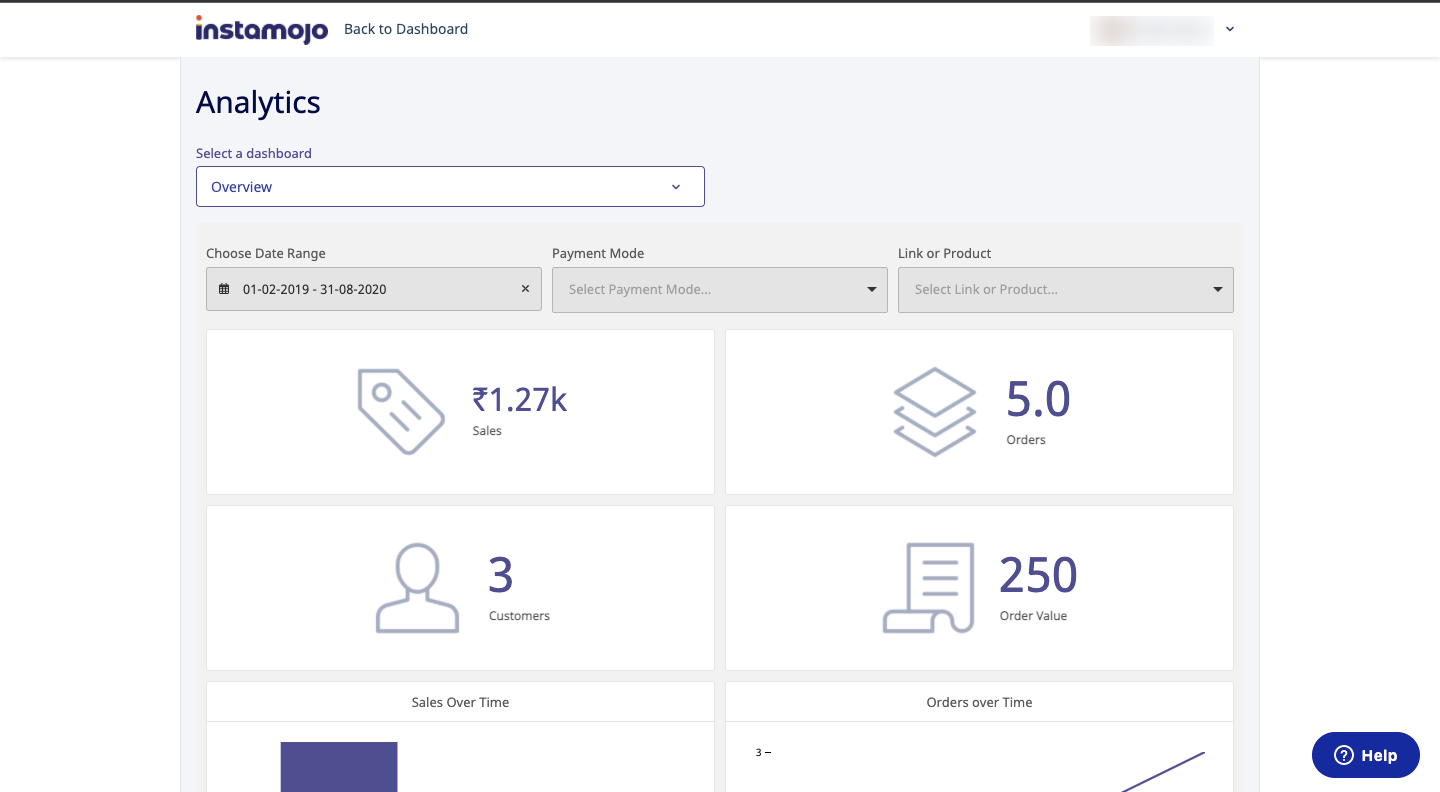
Once you click on Analytics, you will be led to a separate section which looks like this:
Note: You can only view analytics once you have set up payments and completed at least 5 or more transactions.
Different analytics available
Once you login to your dashboard, you can now view your analytics. There are 9 charts and tables summarising an overview of sales and customers over time. Here’s what each one of them shows:
1. Sales and transactions overview:
This section shows the sales, number of orders, unique customers, and order value over 4 different pre-selected periods — Yesterday, Last 7 Days, Last 30 Days and Lifetime.
2. Sales volume graphs:
In the next section, you can find two graphs on sales and orders. The first is a bar graph that shows sales made over different time periods and the second is a graph showing the number of orders over time.
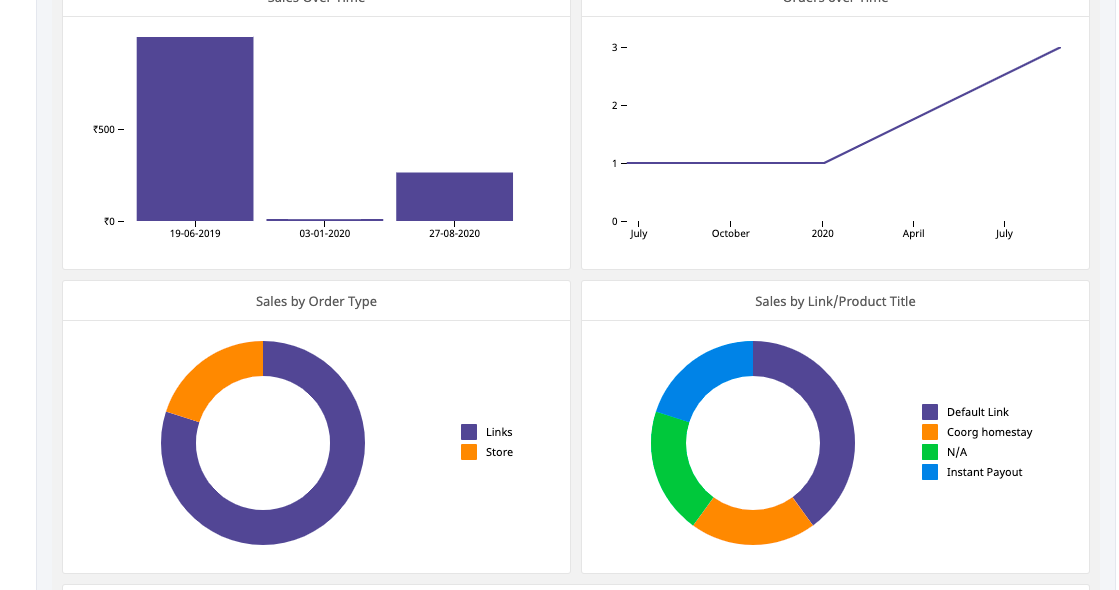
3. Sales by order types:
You can also find two graphs that shows percentage of order types based on product titles or links. By tracking individual products, you can find out which ones are more popular.
4. All payments:
Lastly, you have a list of sales along with the dates and order value.
With this data, you can easily track conversions and find out what’s working for on your store.
Interactive filters
To streamline your data, Instamojo store analytics gives you the option to apply interactive filters. Thus, you can find and compare sales and orders. The two available filters are date range filter and aggregation filter.
1. Date range filter:
With the date range filter, you can expand the range of time on all charts. Select from one of the pre-given options, or choose any custom date range of your choice from the drop down.
2. Aggregation filter:
Use this filter to group the data by your desired time period. Once you choose the filters you want, simply click ‘apply’ to sell the results.
Note: The default filters are kept at Daily and Date Range of 30 Days.
Google analytics on Instamojo store
Apart from the store analytics, you can also access Google analytics data through your Instamojo dashboard. This enables you to have a combination of store analytics and Google analytics all in one place. This way, your data is not scattered across different platforms. Thus, you have access to more powerful data.
You can find the Google Analytics app on the Instamojo App Store, which can be accessed on the left-hand side of your dashboard. This feature is also available for free store users.
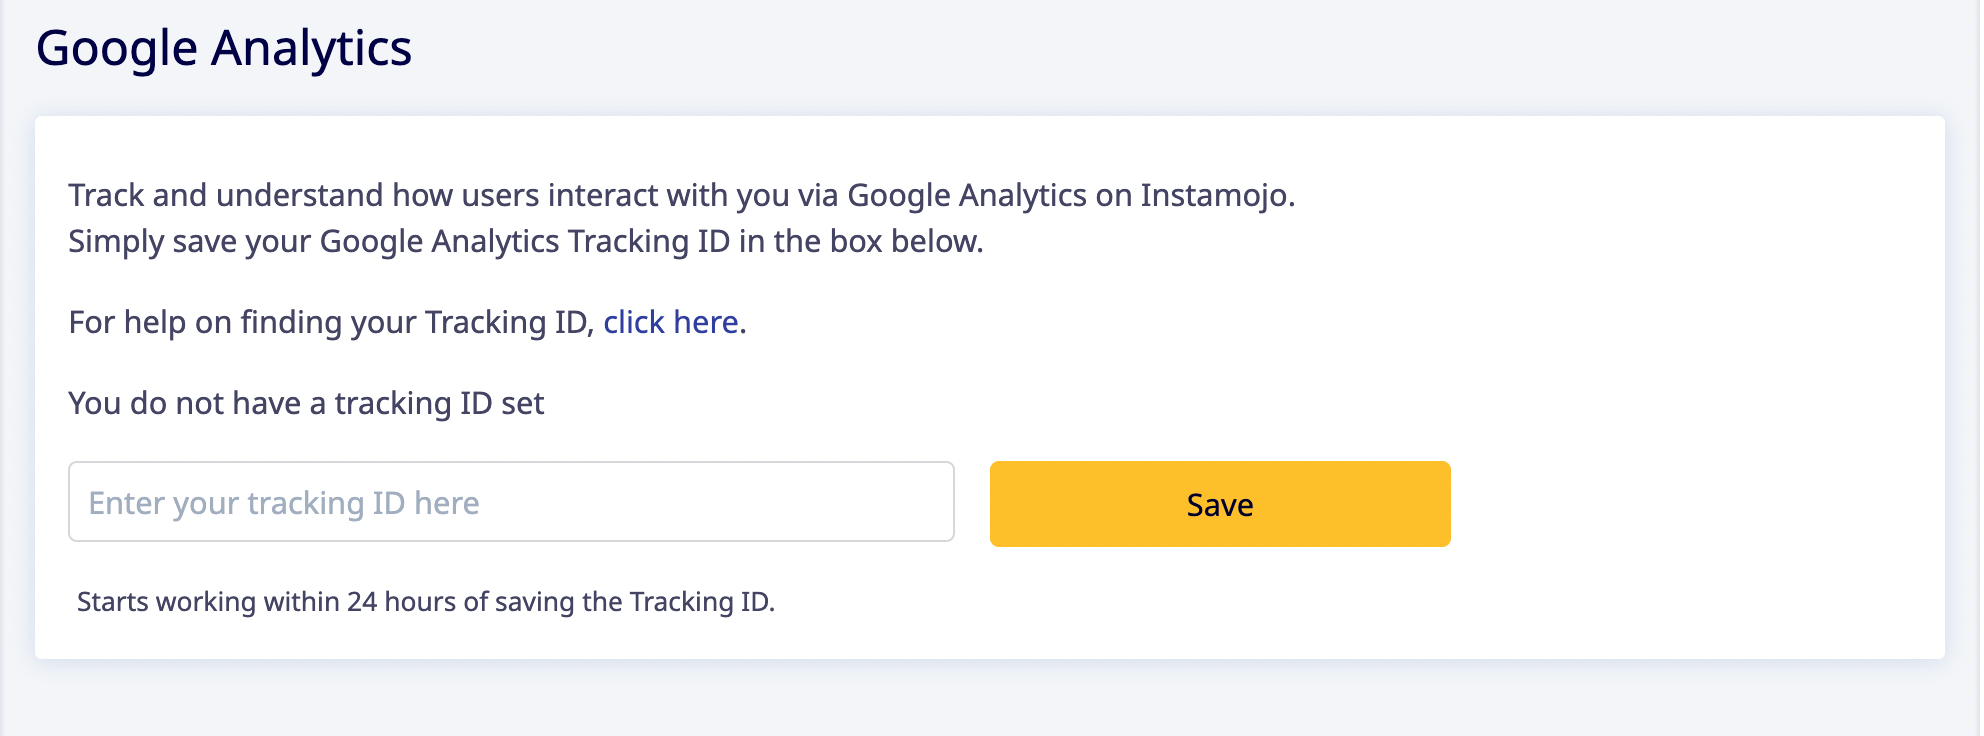
Enter and save your tracking ID from Google Analytics. To know more about creating a tracking ID, read this.
Related Read: CRM for eCommerce: how to manage customers on your online store
What are the benefits of using Instamojo store analytics?
Now that you know how to setup and check analytics for your Instamojo online store, let’s look at how you can benefit from this information.
In simple words, store analytics help you track and understand how users interact with you. So, you’re more aware of what happens in your online store.
When it comes to eCommerce, you need to make decisions and plan marketing based on data. That’s where your store analytics will help you. Here’s why analytics is important to grow your business online:
- Understand trends and patterns which will help you in creating successful marketing campaigns
- Measure the success of marketing campaigns
- Helps optimise store user experience and other elements
- Create effective business strategy
- Cross-sell and up-sell to existing customers
Get powerful analytics on Instamojo online store
If you’re looking to build a successful and sustainable business online, tracking store analytics is the way to go. And Instamojo platform can offer you everything you need to start off. Along with powerful analytics features, also get lots of other eCommerce feature that will help you in customer acquisition, retention, and more sales.
Sign up on Instamojo and get an online store that will help you grow a successful eCommerce business.
1 comment
Nice and useful article. Thanks a lot