We at Instamojo live and breathe data, every single day. We have always been on top of things that measurably impact our customers. That implies we need to see through data and extract meaningful insights to improve our product & platform.
Our ultimate goal is to use data to personalize customer experience on the Instamojo platform.
While we have made a lot of progress, but still much is left to be done. So today, I thought I’ll share some internal data which impacts you (P.S. No one in the payment industry has ever shared this data publicly). The reason I want to share these data points is to show you by action and performance than just words.
Amongst the many metrics we track on a daily basis, we thought we will share 4 critical metrics & data points today which impact your business numbers.
1. Payment success rate (on a daily basis)
2. Time taken to complete a successful transaction (daily)
3. Average transaction size based on payment mode (daily)
4. Average transaction size based on device type (daily)
1. Payment success rate (on a daily basis)
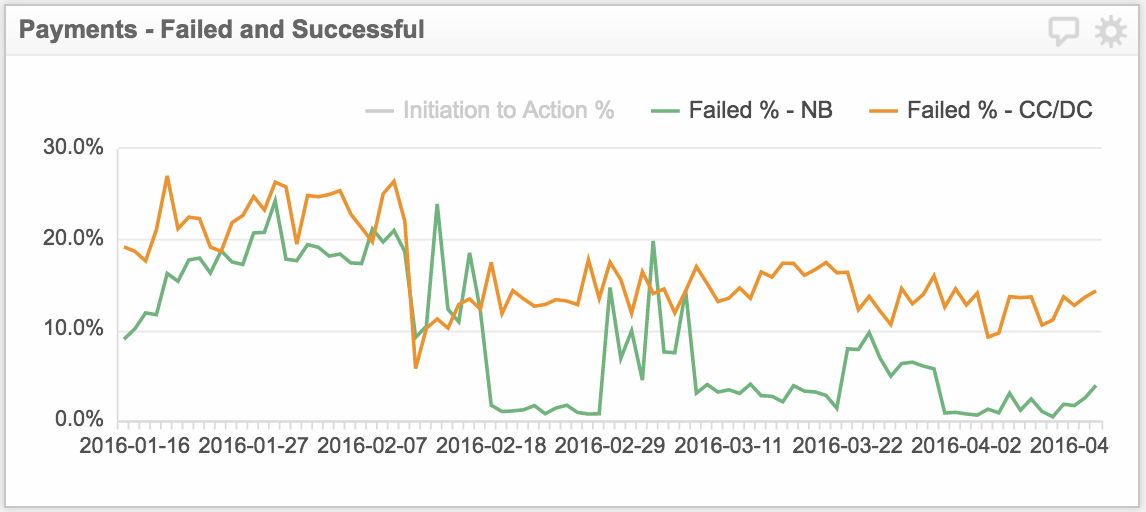
Fact is, the payment success rate is one of the most critical aspects of running an online business. And using a payments platform that’s stable and gives you the best success rate in the industry becomes paramount to your success. We give 88-98% transaction success rate depending on the payment mode. The chart above speaks volumes of that. Let me dissect the chart and pull out some insights:
“Our average transaction failure rate in the last 2-3 months was around 2-12%. We see an average failure rate of 7-12% in credit and debit card transactions.
Whereas, we see around 0.5-2% failure rate in net-banking transactions. In the last 3 months, we have been able to reduce failure by almost 80% in net-banking transactions and 50% in credit/debit card transactions.”
So, we continue to work hard to increase the transaction success rate — that means more money in your pocket. And if you may ask why we face those 2-12% failure rate? It’s primarily due to these 3 reasons which comprises most of all failures:
Customer inputs wrong CVV or 3D Secure Code during checkout.
Bank OTP not coming in time to the customer.
Flaky network connectivity impacts the success rate too.
2. Time taken to complete a successful transaction (daily)
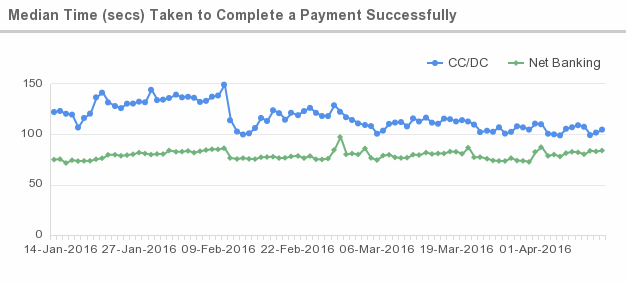
Research shows that our attention span has been reducing. Hence, it becomes imperative that we close a sale as soon as possible. Today, our average closing time from start to finish looks like this:
Fact is, we track the time taken to complete a transaction right from the time customer inputting his 16-digit card information. Hence, possibly a big reason why it takes longer to finish credit card transactions.
It takes around 100 seconds to complete a credit/debit card transaction.
It takes around 75 seconds to complete a net-banking transaction.
Credit/debit card transaction slightly longer than net banking, due to OTP which takes somewhere from 10-45 seconds — this is to follow 2-Factor Authentication (2FA) as mandated by Reserve Bank of India (RBI).
Already, we have reduced the time taken from 130 seconds to 100 seconds today for credit/debit cards by doing a bunch of optimizations around mobile especially.
3. Average transaction size based on payment mode (daily)
![]()
Chart easily shows that people pay higher-priced goods with credit and debit card than net-banking. So if you want to close a high-value sale with your customer, tell them specifically that you provide them Instamojo’s easy credit card option also during checkout. Saying so might turn a potential sale into an actual sale.
4. Average transaction size based on device type (daily)
![]()
The graph above shows how transaction size varies depending on the device that the buyer is using. Let’s put few facts into perspective here:
Averagely, people on the desktop are paying more than any other device and it’s growing.
Mobile is stable at the price-points that people are comfortable paying.
Tablet transaction size is sporadic and sometimes is higher than any other device.
You can use these statistics and data points above to frame your view about how you want to collect your payments. Hope these pointers would help you make more sales and grow your business.
1 comment
Where can I check these details at my dashboard ?