
Data can work magic for businesses. It helps you identify trends, strengths, weaknesses and give you surprising insights on customer behavior. How can small businesses use this to advantage?
Let’s talk about data analytics for small businesses.
Taking direct customer feedback (via conversations or surveys) has always been a great way to collect business insights, but that can only go so far. Customer behavior data can reveal several important things – who is your customer, where they are based out of, what they like and so on.
Instamojo has been empowering businesses of all sizes on its platform. We provide several features like online payments, invoicing, online store, shopping cart etc.
The latest on the list is ‘Pro Analytics’ which allows a small business to get in-depth insights on their customer and their traits.
What is Instamojo Pro Analytics:
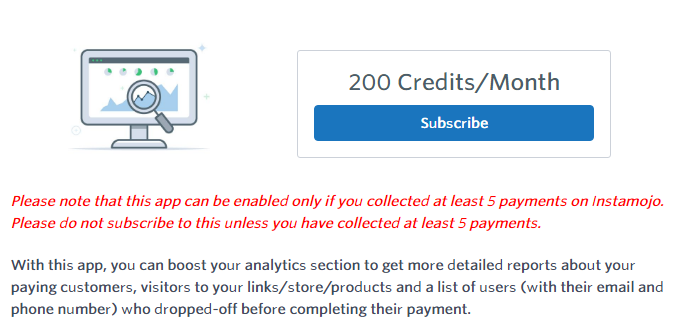
If you are a merchant on Instamojo, you automatically get access to basic analytics in the Analytics section of your dashboard. But with Pro Analytics, you can do so much more.
You get two new reports after you subscribe to the Pro Analytics App.
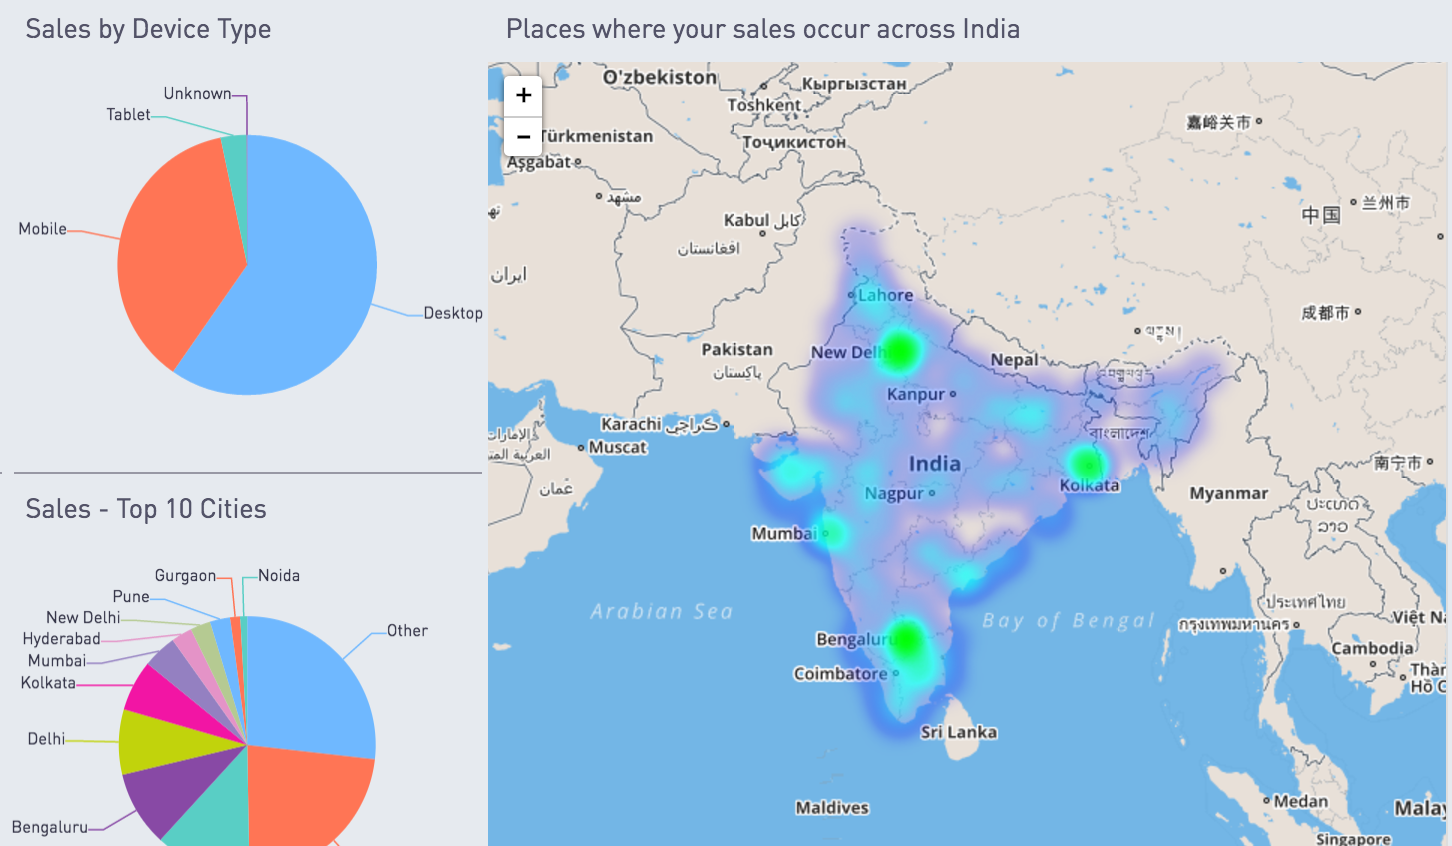
Customer Report:
This dashboard tells you three important things about your customers:
1. What kind of device are they using: Desktop, Mobile or Tablet.
Useful for: Understanding if you need to optimize your website/product for certain devices
2. Where are your customers based
Useful for: Figuring out which cities need more of your attention and marketing, and also the opportunities to expand your business in newer locations
3. Which customers did not finish the payment
Useful for: Re-engaging the dropped off customers over email and phone, trying to convince them to complete their purchase by a) offering a discount code b) reminding them that their purchase is pending or c) offering them an alternative service or product.
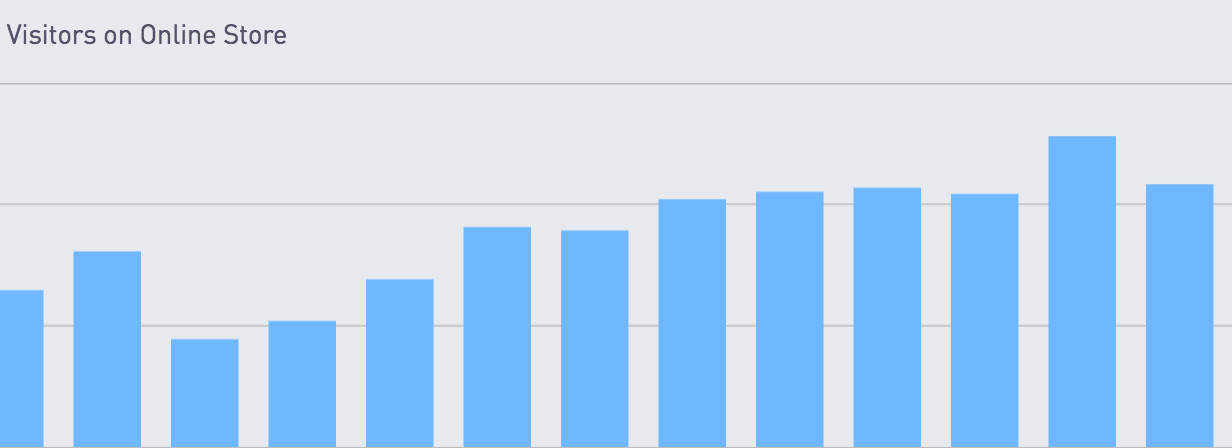
Visitors Report:
This dashboard gives you more insights into how many people are visiting your online store, product links and payment links, and from what sources.
Useful for: Understanding how your marketing campaigns are performing, which channels bring the most traffic to your store/pages/links and the conversion rates on your pages (how many visitors convert to payers).
That’s not it!
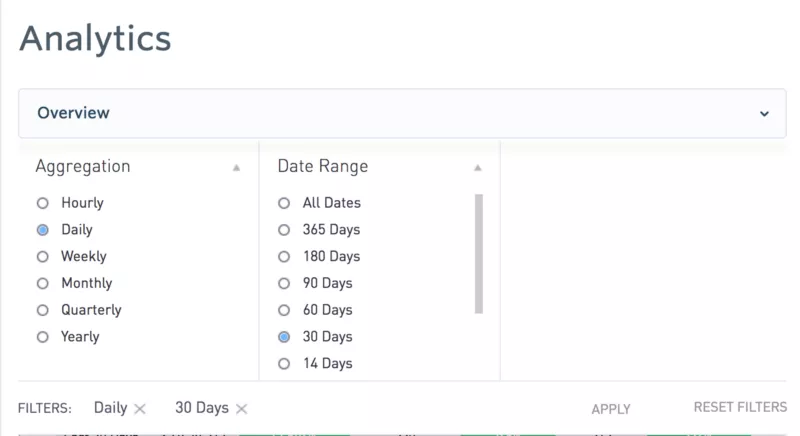
You can filter all the dashboards by any date range that you would like (ranging from all time to last one day), and group relevant charts by days/weeks/months/quarters and years to understand trends in any way you’d prefer.
We hope you will love using this feature as much as we loved building it. It opens up endless possibilities to gain invaluable insights from your sales and payments data. This should help your grow your business by listening to your customers — even when they aren’t directly speaking to you. To subscribe, please go to your app store, or click on the button below.